Does data analysis reduce business risk?
In the design world, but more generally, in the construction industry, we can take these two statements as true:
- If a project is completed perfectly, we could make a profit between 0 and 20 percent;
- If a project goes wrong, the losses could potentially be very high;
So perhaps, we should spend more time reading and understanding the data, to better recognize what are the risk factors and what are the opportunities for margin improvement.
We need to move away from the idea that BIM is simply a better way to produce boards and drawings, with a dash of object-related data, clash detection, and the ability to go to 4D, 5D, 6D, 7D.
The next goal to be achieved and the real benefit given by completing a project or job order by adopting this methodology will be to reduce the various risk factors as much as possible, and this will be possible through the implementation and study of the analysis of the data we produce between models, work activities, resources and tools. All of this data, if properly interpreted, can lead to great margin and profit opportunities.
For several years now here at La SIA, we have been working on “BIM oriented” projects and orders, that is, evolving on digital management and coordination processes. For this reason, we produce a considerable amount of data on the agenda, considering the large number of resources employed, spread across 9 different locations.

Interpreting data to improve decision-making steps
If we could find a way to actually bring together all the data from all the models we produce, in one macro-database, instead of querying the various files individually and separately, we might perhaps begin to notice some interesting patterns.
By querying this macro-database then, we could get to the point of predicting, for a given type of job or project, how much it will cost, how many resources it will require, what tools, and on what budget.
Today these analyses are done based on the past experience of the various professionals involved, but it is clear that doing this type of analysis, based on data, will lead to much more objective and measurable conclusions. So combining experience on the one hand and increasingly robust data collection on the other will undoubtedly enable us to improve the quality of the choices we face from project to project.

The implementation test
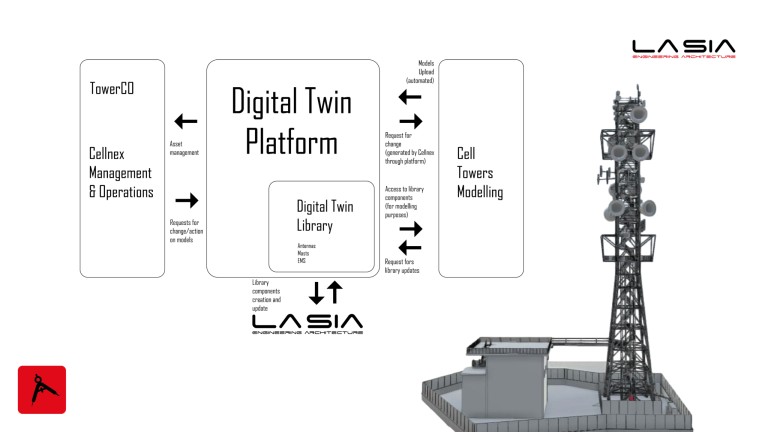
In recent years, at La SIA, we have begun to experiment with this kind of approach, arriving at increasingly reliable and trustworthy results. One of the most important orders, in terms of duration and number of resources employed, is the digitization of an entire infrastructure asset, on behalf of one of the most important companies in the telecommunications industry.
From the earliest stages of the start-up of this order, we began to collect various types of data, such as the dates the models were started and completed, the resources who worked on them, the tools they used and the frequency with which they used these tools, and more.
We then began to analyze this data, trying to identify those famous patterns we were talking about earlier. As the weeks passed, the number of data began to grow considerably, leading us, for example, to a better understanding of work activities, to add an additional “step” for checking and validating the various models, and help us in managing and planning future activities.
These initial results, in addition to improving our own operational workflow, have, above all, brought benefits toward the client, who can plan his activities based, therefore, on certain and verified data.